
ITU releases latest tech figures & global rankings
- 250 million additional people came online in 2012
- Republic of Korea tops ICT ranking for 3rd year in a row
- By end 2013 40% of the world will be online – but 1.1 billion households – or 4.4 billion people – remain unconnected
- Mobile broadband is now more affordable than fixed broadband
- Almost the whole world is now within reach of mobile cellular service
- 30% of the world’s young population are ‘digital natives’
- Broadband is getting faster; 2Mbps now most popular basic package
- Telco operator CAPEX peaked in 2008; despite economic upturn investment levels have not returned
Download 4 comprehensive infographics showing key global trends
Geneva, 7 October 2013 – Mobile broadband over smartphones and tablets has become the fastest growing segment of the global ICT market, according to ITU’s flagship annual report Measuring the Information Society 2013.
New figures released today show buoyant global demand for information and communication technology (ICT) products and services, steadily declining prices for both cellular and broadband services, and unprecedented growth in 3G uptake.
By end 2013 there will be 6.8 billion total mobile-cellular subscriptions – almost as many as there are people on the planet.
An estimated 2.7 billion people will also be connected to the Internet – though speeds and prices vary widely, both across and within regions.
Mobile broadband connections over 3G and 3G+ networks are growing at an average annual rate of 40 per cent, equating to 2.1 billion mobile-broadband subscriptions and a global penetration rate of almost 30 per cent. Almost 50 per cent of all people worldwide are now covered by a 3G network.
ICT Development Index country rankings
New data from the 2013 edition of Measuring the Information Society reveal that the Republic of Korea leads the world in terms of overall ICT development for the third consecutive year, followed closely by Sweden, Iceland, Denmark, Finland and Norway.
The Netherlands, the United Kingdom, Luxembourg and Hong Kong (China) also rank in the top 10, with the UK nudging into the top 10 group from 11th position last year.
ITU’s ICT Development Index (IDI)* ranks 157 countries according to their level of ICT access, use and skills, and compares 2011 and 2012 scores. It is widely recognized by government, UN agencies and industry as the most accurate and impartial measure of overall national ICT development.
Top performers – and connectivity challenges
All countries in the IDI top 30 are high-income countries, underlining the strong link between income and ICT progress.
There are large differences between developed and developing countries, with IDI values on average twice as high in the developed world compared with developing countries.
The report identifies a group of ‘most dynamic countries’, which have recorded above-average improvements in their IDI rank or value over the past 12 months. These include (in order of most improved): United Arab Emirates, Lebanon, Barbados, Seychelles, Belarus, Costa Rica, Mongolia, Zambia, Australia, Bangladesh, Oman and Zimbabwe.
The report also identifies the countries with the lowest IDI levels – so-called Least Connected Countries (LCCs). Home to 2.4 billion people – one third of the world’s total population – the Least Connected Countries are also the countries that could potentially derive great benefits from better access to and use of ICTs in areas such as health, education and employment.
“This year’s IDI figures show much reason for optimism, with governments clearly prioritizing ICTs as a major lever of socio-economic growth, resulting in better access and lower prices,” said ITU Secretary-General Dr Hamadoun I. Touré. “Our most pressing challenge is to identify ways to enable those countries which are still struggling to connect their populations to deploy the networks and services that will help lift them out of poverty.”
Broadband pricing & affordability
Analysis of trends in broadband pricing in more than 160 countries shows that in the four years between 2008-2012 fixed-broadband prices fell by 82 per cent overall, from 115.1 per cent of average monthly income per capita (GNI p.c.) in 2008 to 22.1 per cent in 2012.
The biggest drop occurred in developing countries, where fixed-broadband prices fell by 30 per cent year on year between 2008 and 2011.
The average price per unit of speed (Mbps) also decreased significantly between 2008 and 2012, with a global median price of USD 19.50 per Mbps in 2012, almost a quarter of the price that was being charged in 2008.
The report also presents for the first time the results of a comprehensive price data collection exercise that was carried out for four different types of mobile-broadband service. Results show that in developing countries mobile broadband is now more affordable than fixed broadband, but still much less affordable than in developed countries.
Austria has the world’s most affordable mobile broadband, while Sao Tomé and Principe, Zimbabwe and the Democratic Republic of the Congo have the least affordable, with service cost equal to or higher than average monthly gross national income (GNI) per capita. Other countries that rank well for mobile broadband affordability include Qatar, the United Kingdom, Germany, Kuwait and France.
The global broadband affordability target set in 2011 by the ITU/UNESCO Broadband Commission for Digital Development aims to bring the cost of entry-level broadband service to less than 5% of average monthly income.
Digital natives
A new model developed by ITU for this year’s report estimates the size of the digital native population worldwide, showing that in 2012 there were around 363 million digital natives out of a world population of around 7 billion. This equates to 5.2 per cent of the total global population, and 30 per cent of the global youth population. The model defines digital natives as networked youth aged 15-24 years with five or more years of online experience.
Out of a total of 145 million young Internet users in the developed countries, 86.3 per cent are estimated to be digital natives, compared with less than half of the 503 million young Internet users in the developing world. Within the next five years, the digital native population in the developing countries is forecast to more than double.
The report shows that, globally speaking, young people are almost twice as networked as the global population as a whole, with the age gap more pronounced in the developing world.
“This first-ever global measurement of the number of digital natives is very timely, coming just after the presentation to the UN General Assembly in New York of the Youth Declaration developed at ITU’s BYND2015 Global Youth Summit, by Costa Rican President Laura Chinchilla. Young people are the most enthusiastic adopters and users of ICTs. They are the ones who will shape the direction of our industry in the coming decades, and their voice needs to be heard,” said Brahima Sanou, Director of ITU’s Telecommunication Development Bureau, which produces the MIS report.
Digital divide
At the beginning of 2013 almost 80 per cent of households globally had a TV, compared with 41 per cent of households with a computer and 37 per cent with Internet access.
The report shows that the number of households with Internet access is increasing in all regions, but large differences persist, with penetration rates at the end of this year set to reach almost 80 per cent in the developed world, compared with 28 per cent in the developing world.
An estimated 1.1 billion households worldwide are not yet connected to the Internet, 90 per cent of which are in the developing world.
The trend is strongly positive, however, with the proportion of households with Internet access in developing countries increasing from 12 per cent in 2008 to 28 per cent in 2013 – a remarkable 18 per cent compound annual growth rate (CAGR).
Internet users as a percentage of the population has been growing on average at double-digit rates over the past ten years. The percentage of the population online in the developed world will reach almost 77 per cent by end 2013, compared with 31 per cent in the developing world.
Telecoms investment
ITU research shows that telecommunication operators’ capital expenditure (CAPEX) peaked in 2008 with global investment totalling USD 290 billion, followed by two consecutive years of decline. Despite the upturn in 2011, 2008 investment levels have not yet been restored.
Sluggish investment levels after 2008 are consistent with an overall economic environment of restricted access to capital markets, which may limit the capacity of operators to raise funds for new investments. With the expansion of global operators into new markets, many operators are active in both developing and developed countries, with the adverse financial environment in the developed world likely impairing investments in the developing world.
See a selection of charts and tables highlighting key findings here.
Measuring the Information Society 2013: Charts and Tables
| Chart 1: IDI rankings end 2012 | ||
| ICT Development Index, Selected economies, 2012 | ||
 | ||
| Source: ITU | ||
| Table 1: Most dynamic countries – changes between IDI 2012 and 2011 | ||
 | ||
| Source: ITU. Note: * Australia, Bangladesh, Oman and Zimbabwe all went up four places in the IDI rankings between 2011 and 2012. | ||
| Figure 1: Least connected countries (LCCs), end 2012 | ||
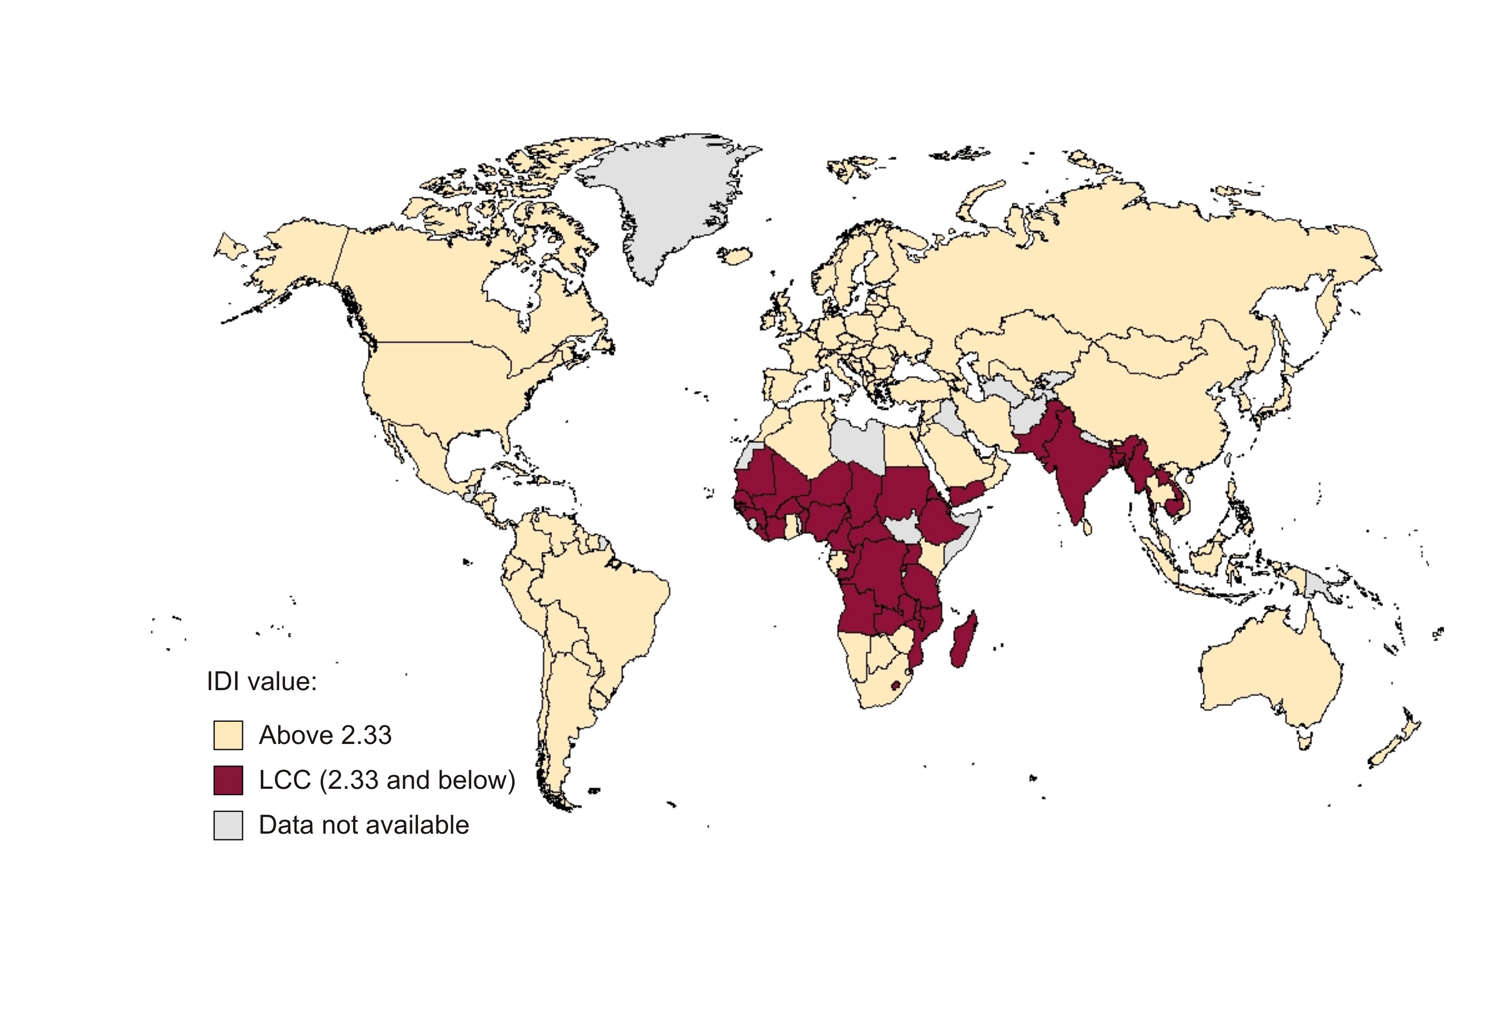 | ||
| Source: ITU | ||
| Chart 2: Fixed-broadband prices, as a percentage of GNI per capita | ||
 | ||
| Source: ITU. GNI p.c. is based on World Bank data. Note: Simple averages. Based on 144 economies for which 2008, 2009, 2010, 2011 and 2012 fixed-broadband prices were available. | ||
| Chart 3: Digital natives as a percentage of total population, by region and level of development, end 2012 | ||
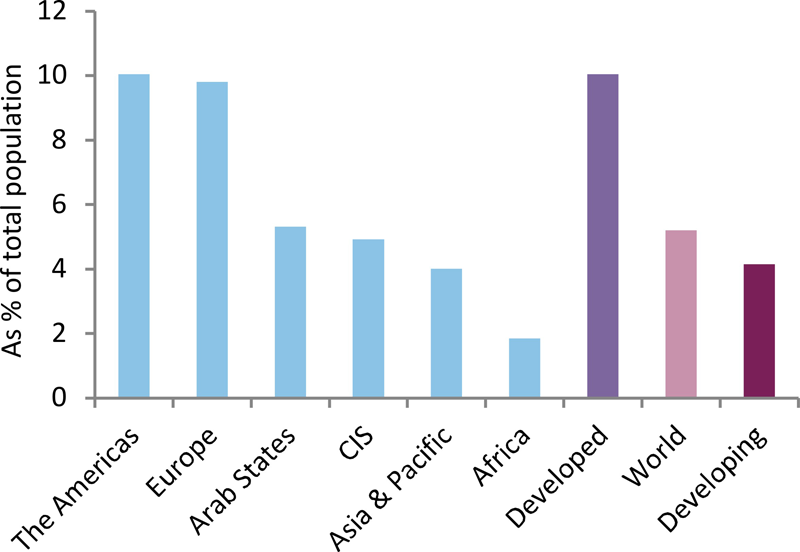 | ||
| Source: ITU | ||
| Chart 4: Digital natives as a percentage of youth (15-24), by region and level of development, end 2012 | ||
 | ||
| Source: ITU | ||
| Chart 5: Percentage of households with Internet access by level of development, 2003-2013* | ||
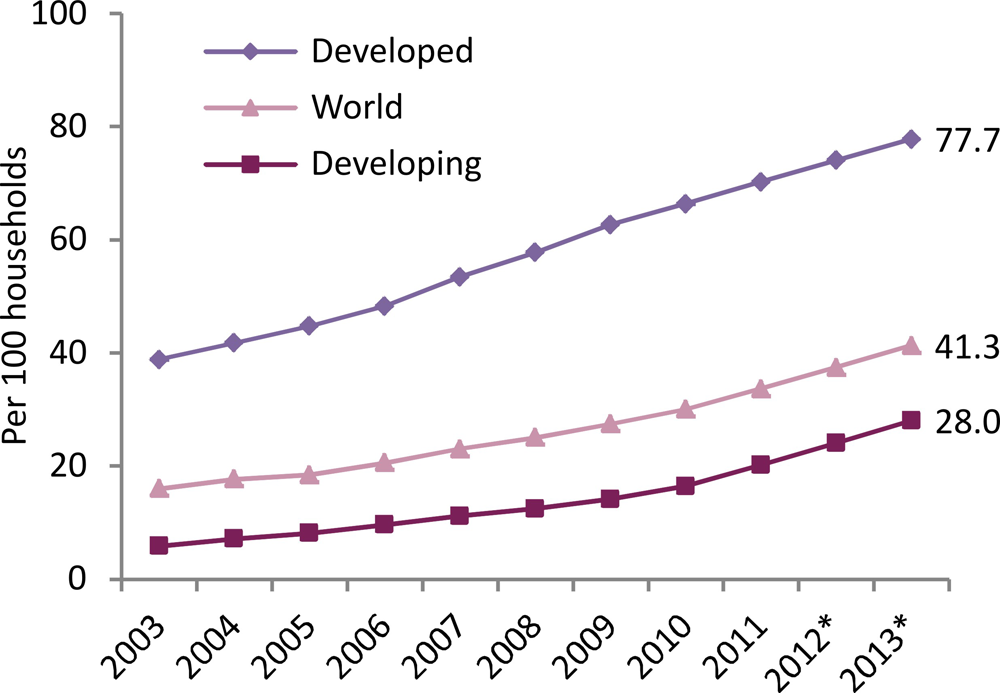 | ||
| Source: ITU. Note: * Estimate. | ||
| Chart 6: Annual Investment (CAPEX) of telecommunication operators, world and by level of development, 2007-2011, total in USD | ||
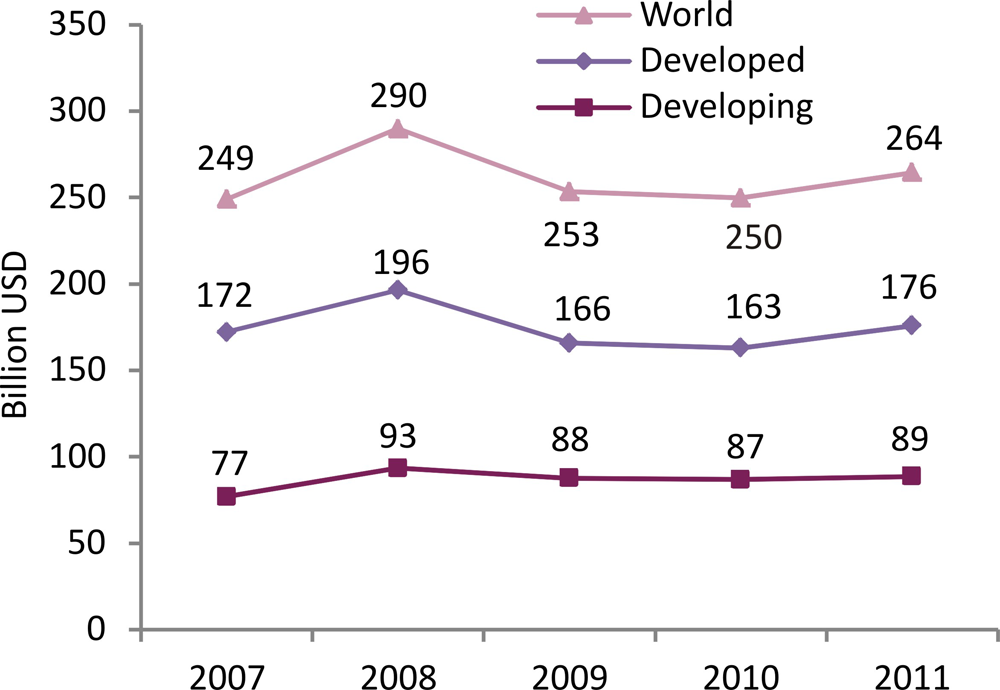 | ||
| Source: ITU. Note: ‘World’ includes 67 countries accounting for 87 per cent of world GDP. ‘Developed’ includes 31 developed countries accounting for 96 per cent of total GDP in the developed world. ‘Developing’ includes 36 developing countries accounting for 72 per cent of total GDP in the developing world. | ||
The IDI combines 11 indicators into a single measure that can be used as a benchmarking tool globally, regionally, and at national level, as well as helping track progress in ICT development over time. It measures ICT access, use and skills, and includes such indicators as mobile cellular subscriptions, households with a computer, Internet users, fixed and mobile broadband Internet subscriptions, and basic literacy rates.
ITU statistics are widely recognized as the world’s most reliable and impartial global data on the state of the global ICT industry. They are used extensively by leading intergovernmental agencies, financial institutions and private sector analysts worldwide.
ITU statistics are available at www.itu.int/en/ITU-D/statistics
An Executive Summary of the MIS 2013 report can be found at: www.itu.int/go/mis2013
Journalists wishing to receive a free copy of the full report in PDF format should contact Sarah Parkes at the ITU Press Office atsarah.parkes@itu.int.
Download the MIS 2013 infographics at: www.itu.int/go/mis2013
Download the MIS 2013 PowerPoint presentation at: www.itu.int/go/mis2013
Download images and photos of the launch at: www.flickr.com/photos/itupictures/collections/72157631727644317/
View the archived webcast of the launch at: http://www.itu.int/ibs/ITU-D/20131007mis-report/index.phtml
Follow the discussion on Twitter at: #ITUdata
About ITU
ITU is the leading United Nations agency for information and communication technology. For nearly 150 years, ITU has coordinated the shared global use of the radio spectrum, promoted international cooperation in assigning satellite orbits, worked to improve communication infrastructure in the developing world, and established the worldwide standards that foster seamless interconnection of a vast range of communications systems. From broadband networks to new-generation wireless technologies, aeronautical and maritime navigation, radio astronomy, satellite-based meteorology and converging fixed-mobile phone, Internet and broadcasting technologies, ITU is committed to connecting the world.
